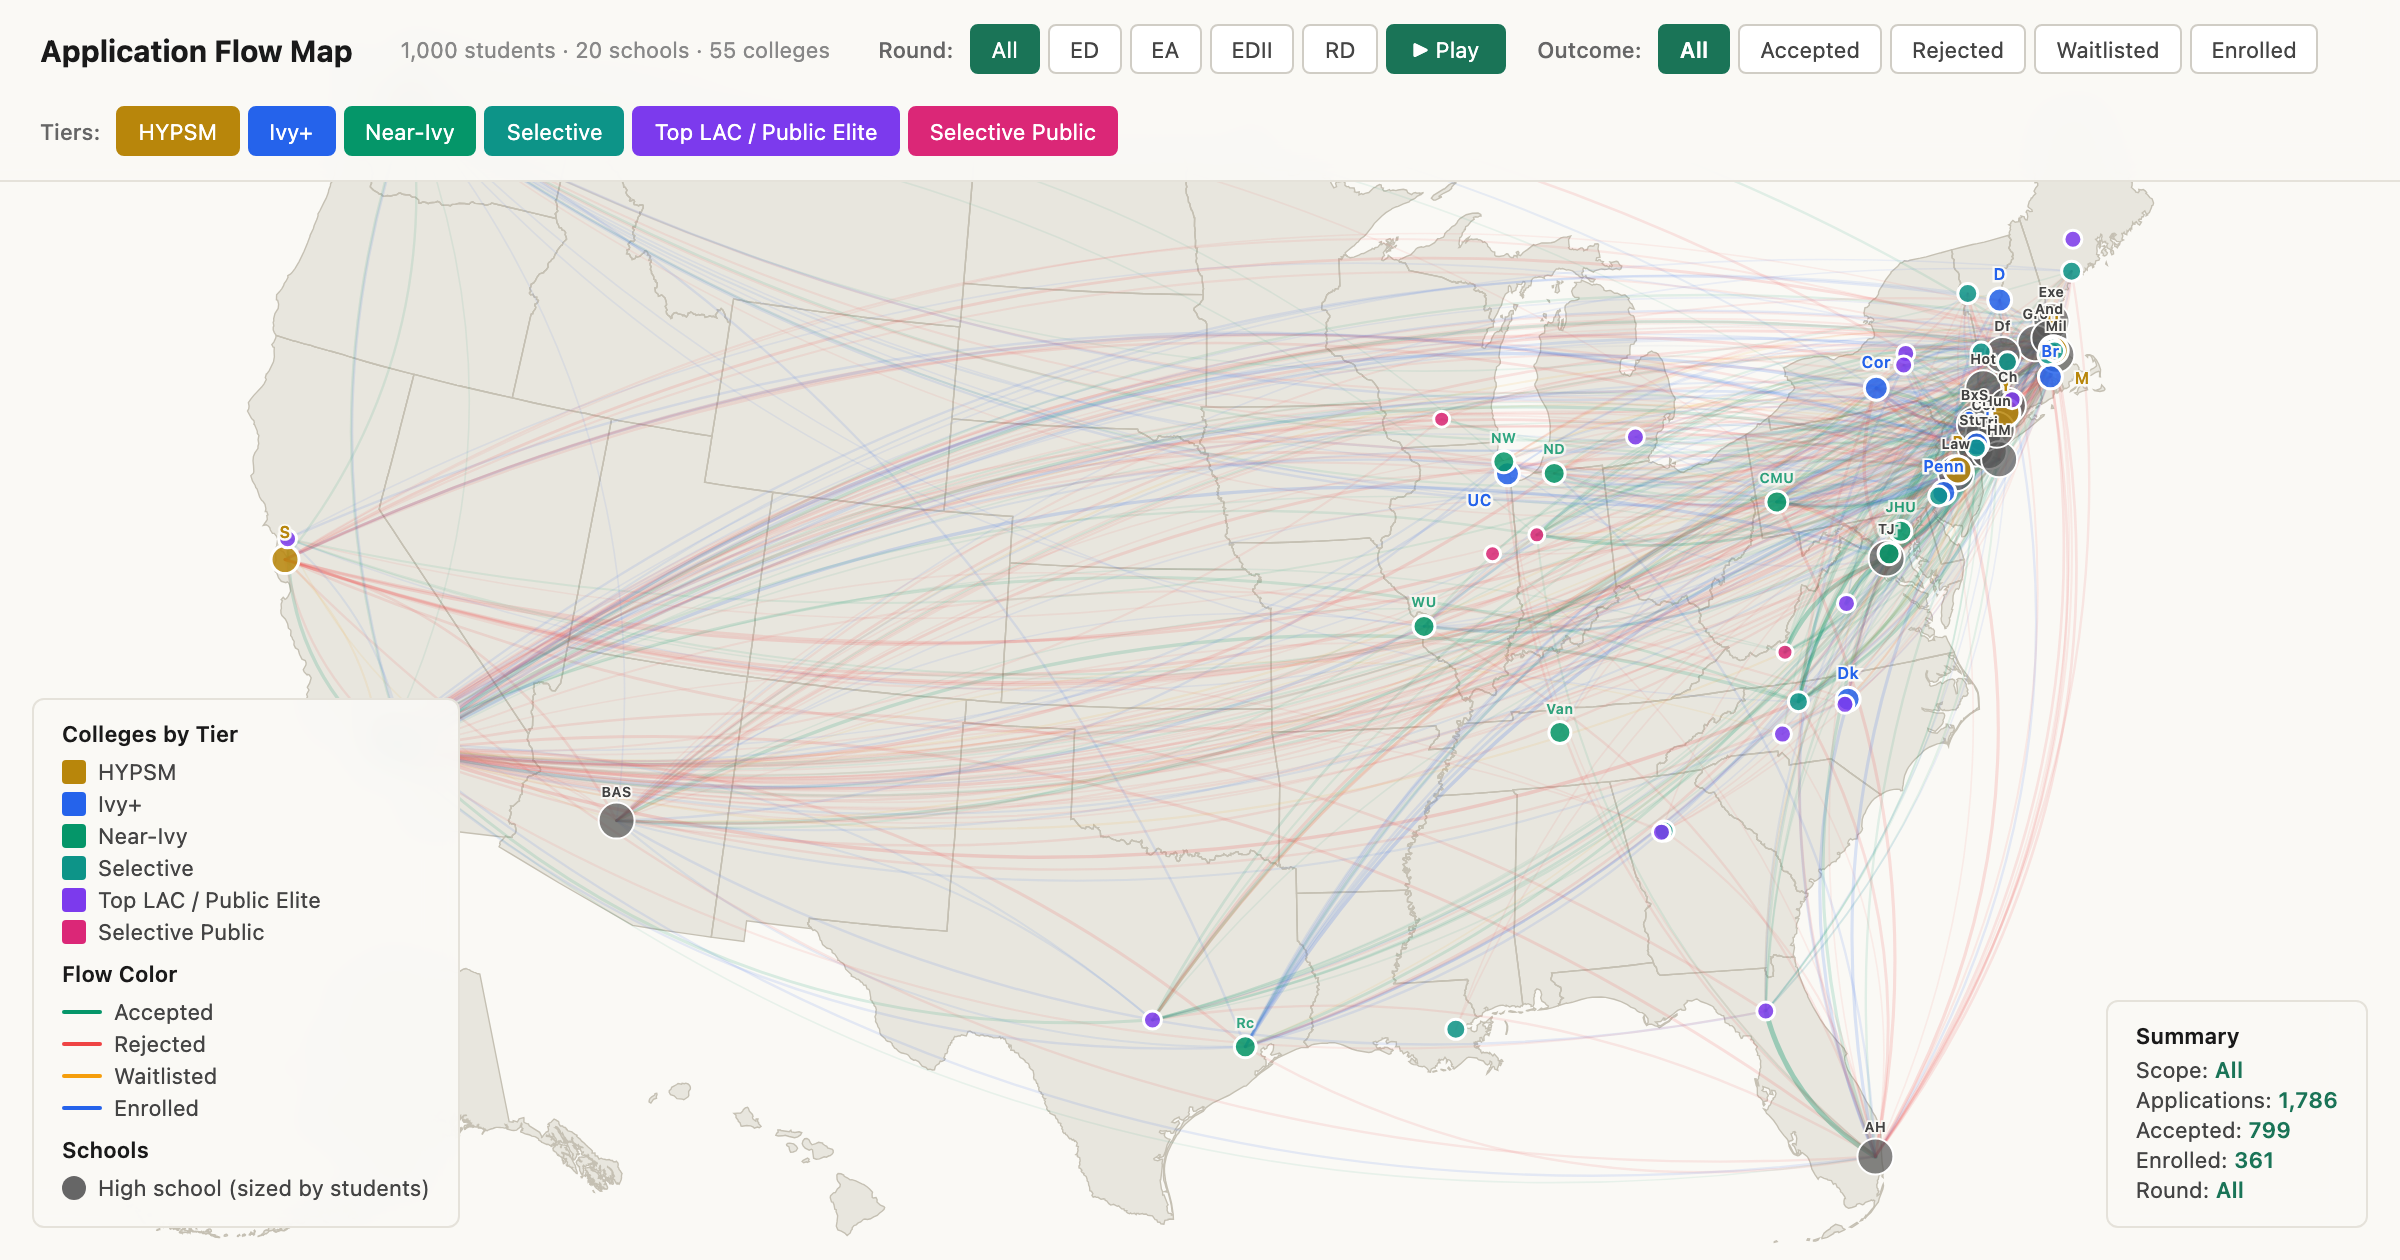
195 colleges. 6 admission rounds. 100 Monte Carlo simulations. See exactly where you stand — and why the system works the way it does.
Follow one complete admissions cycle from Early Decision through the waitlist. A 7-chapter scrolling narrative that shows you exactly how 1,000 students get sorted into 55 colleges.
Read the story →An interactive US map with 681 animated arcs showing every application flow — from 20 high schools to 55 colleges. Filter by round, outcome, and tier to see the patterns behind the numbers.
Explore the map →Harvard admitted 12% in 1995. Today it's under 4%. This animated timeline shows exactly how and why admissions got so much more competitive — and what it means for you.
See what changed →